

This gear ratio chart shows engine RPM at 65 mph for common axle ratios and tire diameters, assuming a 1:1 top gear (direct drive). Find your tire size down the left, read across to your gear ratio, and you’ll see exactly where your engine sits at highway speed — and what a re-gear or a tire change would do to it.
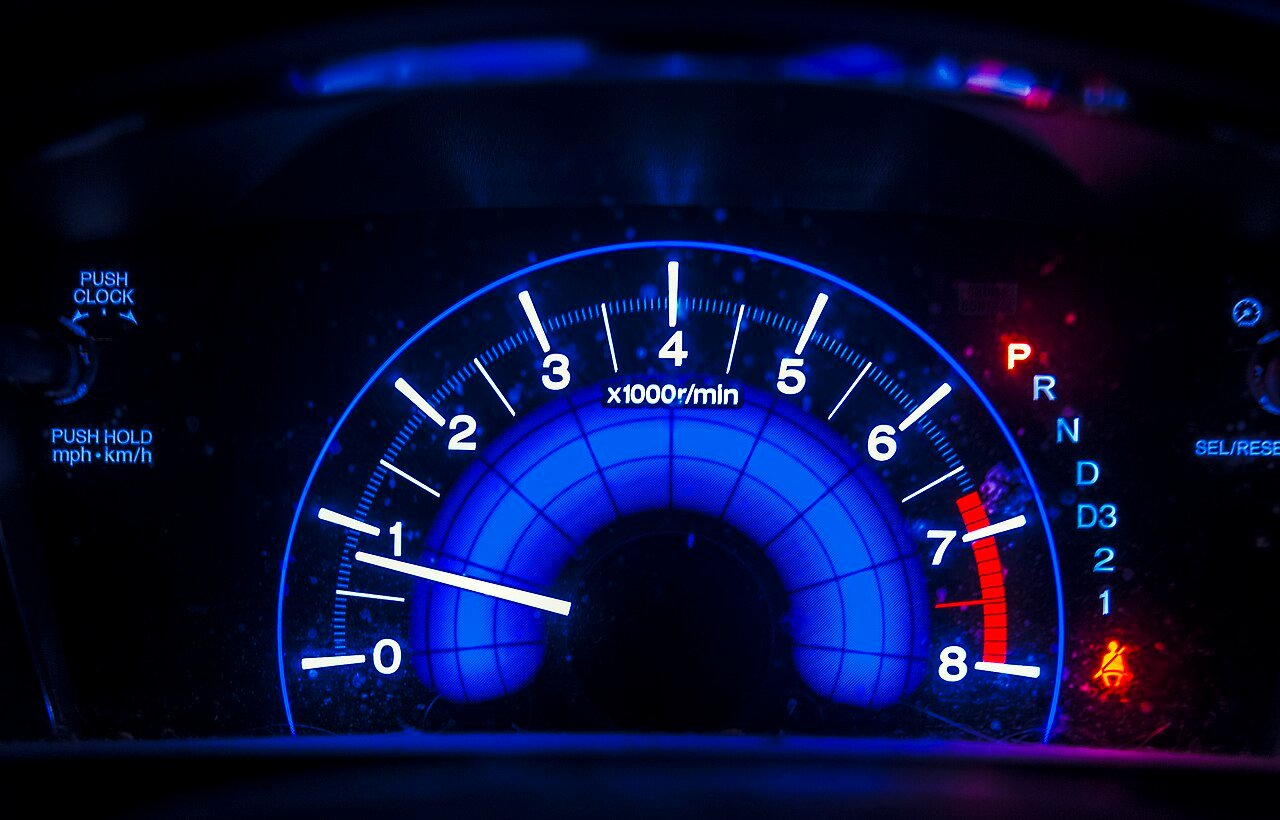
Gear ratio chart: RPM at 65 mph by tire size
| Tire | 2.73 | 3.08 | 3.42 | 3.73 | 3.91 | 4.10 | 4.56 | 4.88 |
|---|---|---|---|---|---|---|---|---|
| 26″ | 2,294 | 2,588 | 2,874 | 3,134 | 3,286 | 3,445 | 3,832 | 4,101 |
| 27″ | 2,209 | 2,492 | 2,767 | 3,018 | 3,164 | 3,318 | 3,690 | 3,949 |
| 28″ | 2,130 | 2,403 | 2,669 | 2,911 | 3,051 | 3,199 | 3,558 | 3,808 |
| 29″ | 2,057 | 2,320 | 2,577 | 2,810 | 2,946 | 3,089 | 3,435 | 3,677 |
| 30″ | 1,988 | 2,243 | 2,491 | 2,716 | 2,848 | 2,986 | 3,321 | 3,554 |
| 31″ | 1,924 | 2,171 | 2,410 | 2,629 | 2,756 | 2,890 | 3,214 | 3,439 |
| 32″ | 1,864 | 2,103 | 2,335 | 2,547 | 2,670 | 2,799 | 3,113 | 3,332 |
| 33″ | 1,807 | 2,039 | 2,264 | 2,470 | 2,589 | 2,715 | 3,019 | 3,231 |
| 34″ | 1,754 | 1,979 | 2,198 | 2,397 | 2,513 | 2,635 | 2,930 | 3,136 |
| 35″ | 1,704 | 1,923 | 2,135 | 2,328 | 2,441 | 2,559 | 2,847 | 3,046 |
| 36″ | 1,657 | 1,869 | 2,076 | 2,264 | 2,373 | 2,488 | 2,767 | 2,962 |
| 37″ | 1,612 | 1,819 | 2,020 | 2,203 | 2,309 | 2,421 | 2,693 | 2,882 |
| 38″ | 1,570 | 1,771 | 1,966 | 2,145 | 2,248 | 2,357 | 2,622 | 2,806 |
| 39″ | 1,529 | 1,725 | 1,916 | 2,090 | 2,190 | 2,297 | 2,555 | 2,734 |
| 40″ | 1,491 | 1,682 | 1,868 | 2,037 | 2,136 | 2,239 | 2,491 | 2,666 |
| 41″ | 1,455 | 1,641 | 1,822 | 1,988 | 2,084 | 2,185 | 2,430 | 2,600 |
| 42″ | 1,420 | 1,602 | 1,779 | 1,940 | 2,034 | 2,133 | 2,372 | 2,539 |
| 43″ | 1,387 | 1,565 | 1,738 | 1,895 | 1,987 | 2,083 | 2,317 | 2,480 |
| 44″ | 1,356 | 1,529 | 1,698 | 1,852 | 1,942 | 2,036 | 2,264 | 2,423 |
How this gear ratio chart is built
Every cell comes from one formula: RPM = (speed × axle ratio × 336.13) ÷ tire diameter. Spot-check any cell — the table says 2,629 RPM for 31-inch tires with 3.73 gears: (65 × 3.73 × 336.13) ÷ 31 = 81,495 ÷ 31 = 2,629. It matches because the chart is the formula, printed out.
Automatics with a non-lockup converter run slightly higher; an overdrive top gear runs lower — multiply the chart value by your overdrive ratio (e.g. × 0.70). HowStuffWorks walks through the gear-ratio math visually, and Wikipedia’s gear train overview covers the engineering behind it.
How to read the gear ratio chart: three zones
- Economy zone (roughly 1,600–2,100 RPM at 65 mph): quiet cruising and the best fuel mileage, but the engine may feel lazy and automatics will downshift on hills or when towing.
- Everyday zone (roughly 2,100–2,600 RPM): the sweet spot for daily driving — responsive without being busy, and where most factory setups land.
- Power / towing zone (roughly 2,600+ RPM): strong pull, better cooling and throttle response, happy towing and off-road engines — at the cost of fuel and noise.
What the gear ratio chart tells you about a tire upgrade
This gear ratio chart makes the trade visible. Taller tires lower your cruise RPM because each revolution covers more road — but they also lengthen your effective gearing, which dulls acceleration. Example: a truck on 31″ tires with 3.73 gears cruises at 2,629 RPM. Move to 35″ tires and it drops to 2,328 RPM — the engine now works like it has roughly 3.30 gears. To restore the original feel, re-gear to about 4.21 (the closest buyable sets are 4.10 and 4.30).
Our tire gear ratio calculator does this exact math — effective ratio, restore ratio, and the nearest gear sets you can actually buy — and even accepts your tire’s published revs-per-mile figure.
Choosing a ratio from the gear ratio chart
- Find your current tire diameter (or measure it — loaded tires measure smaller than the sidewall size suggests).
- Read your current cruise RPM. If it already sits in the zone you want, a re-gear buys you nothing.
- Pick the column that lands in your target zone for your tire row — that’s your ratio.
- Round to a ratio that actually exists for your axle, then confirm with the axle ratio calculator, which accounts for your exact transmission gears and target RPM.
Using the gear ratio chart to solve for a ratio
The chart also works backwards. Want 2,400 RPM at 65 mph on 35-inch tires? Rearrange the formula: ratio = (RPM × tire diameter) ÷ (65 × 336.13) = (2,400 × 35) ÷ 21,848 = 3.84. The closest buyable gear sets are 3.73 and 4.10 — and now you know exactly which column of the gear ratio chart each one lands you in.
What the gear ratio chart doesn’t show
Three real-world fudge factors. Torque-converter slip: older non-lockup automatics run 100–300 RPM higher than the chart. Loaded tire diameter: a “35-inch” tire measures closer to 34 inches under the truck’s weight — use the loaded number for the closest match. Speedometer error: if your speedo is off, the “65 mph” you’re reading isn’t really 65 — see our speedometer diagnosis guide. The chart is exact math on nominal inputs; measure your actuals for garage-grade accuracy.
Worked example: planning a re-gear off the chart
Say your truck runs 33-inch tires with 3.42 gears and tows a camper on weekends. Find the 33″ row on the gear ratio chart and read across: your current setup sits at 2,264 RPM — the top of the economy zone, which is why the transmission hunts on grades with the trailer on.
Now read further across the same row: 3.73 gears give 2,470 RPM (everyday zone), and 4.10 gears give 2,715 RPM — squarely in the power/towing zone. With a 0.70 overdrive, that 4.10 cruise drops to 2,715 × 0.70 = 1,901 RPM on the highway, so the re-gear costs you almost nothing in daily comfort. That is the whole workflow this gear ratio chart exists for: find your row, pick your zone, read off the ratio.
Metric tire sizes: finding your row
Most tires are sold in metric sizes, and the chart is in inches — so convert first: diameter = (width × aspect ratio × 2 ÷ 25.4) + wheel size. A common 265/70R17 works out to (265 × 0.70 × 2 ÷ 25.4) + 17 = 31.6 inches.
That lands between the 31″ and 32″ rows. Read both and split the difference: at 3.73 gears, the chart shows 2,629 RPM (31″) and 2,547 RPM (32″), so a 31.6″ tire sits at roughly 2,580 RPM — and the exact formula confirms it: (65 × 3.73 × 336.13) ÷ 31.6 = 2,579. When your size falls between rows, interpolating like this is accurate to a few RPM.
Frequently asked questions
What RPM should I cruise at?
Most gasoline trucks and cars are happy between 1,800 and 2,400 RPM at highway speed. Towing or hauling heavy, 2,400–2,800 keeps the engine in its torque band and the transmission out of constant downshifts.
Is there a gear ratio chart for 70 mph?
You don’t need a separate chart — RPM scales linearly with speed. Multiply any value on this gear ratio chart by 70 ÷ 65 (× 1.077). The 2,629 RPM cell for 31-inch tires and 3.73 gears becomes 2,629 × 1.077 = 2,831 RPM at 70 mph. For any other speed, use the RPM calculator.
Why is my real RPM different from the chart?
The chart assumes a 1:1 gear. Multiply by your top-gear ratio (0.70 overdrive → × 0.70), and allow a few percent for torque-converter slip on older automatics and for tire squat (use the measured, loaded diameter for the closest match).
Does a bigger tire always need a re-gear?
No. A 1–2 inch increase usually just moves you within the same zone. Go 3+ inches taller and the effective gearing change is big enough that most drivers notice the lost pull — that’s when the restore-ratio math matters.
Where can I get RPM for my exact speed and setup?
The chart is fixed at 65 mph. For any speed, gear, and tire combination, use the RPM calculator — it works in both directions (RPM from speed, or speed from RPM).
Every number on this page comes from the same formulas our calculators use — run your exact setup in the gear ratio calculator and see the result live.